Let’s get started: How to use the Climate Innovation Funding Tracker
Note: This post was updated Jan 4, 2024 to include new funding data in the latest version of the Innovation Tracker.
What is it for?
The Climate Innovation Funding Tracker allows users to explore federal funding for climate innovation, and compare funding across sectors, solutions, and innovation stages. Users will be able to ask questions like:
- How much federal spending is going toward different mitigation solutions?
- How is the climate innovation budget distributed among different agencies?
- Which sectors are receiving the majority of climate innovation funding?
These questions may be useful for:
- Helping Congress understand where to focus future investments
- Assisting agency administrators in ensuring interagency budgets complement one another, and providing a deeper understanding of synergies and gaps
- Aiding NGOs in establishing data-driven advocacy platforms
How do you use the Tracker?
To start using the Tracker, select the first filter you’d like to analyze. You have multiple categories to choose from, including “Agency,” “Sector,” “Solution,” “Innovation Stage,” “Funding Type,” or “Funding Source”.
For example, let’s say you are interested in learning which government agencies are funding climate innovation in the Transportation sector and how much they spent last year.
First, drag and drop the filter for “Sector” into the empty box at left, which will bring up the list of tracked innovation areas.
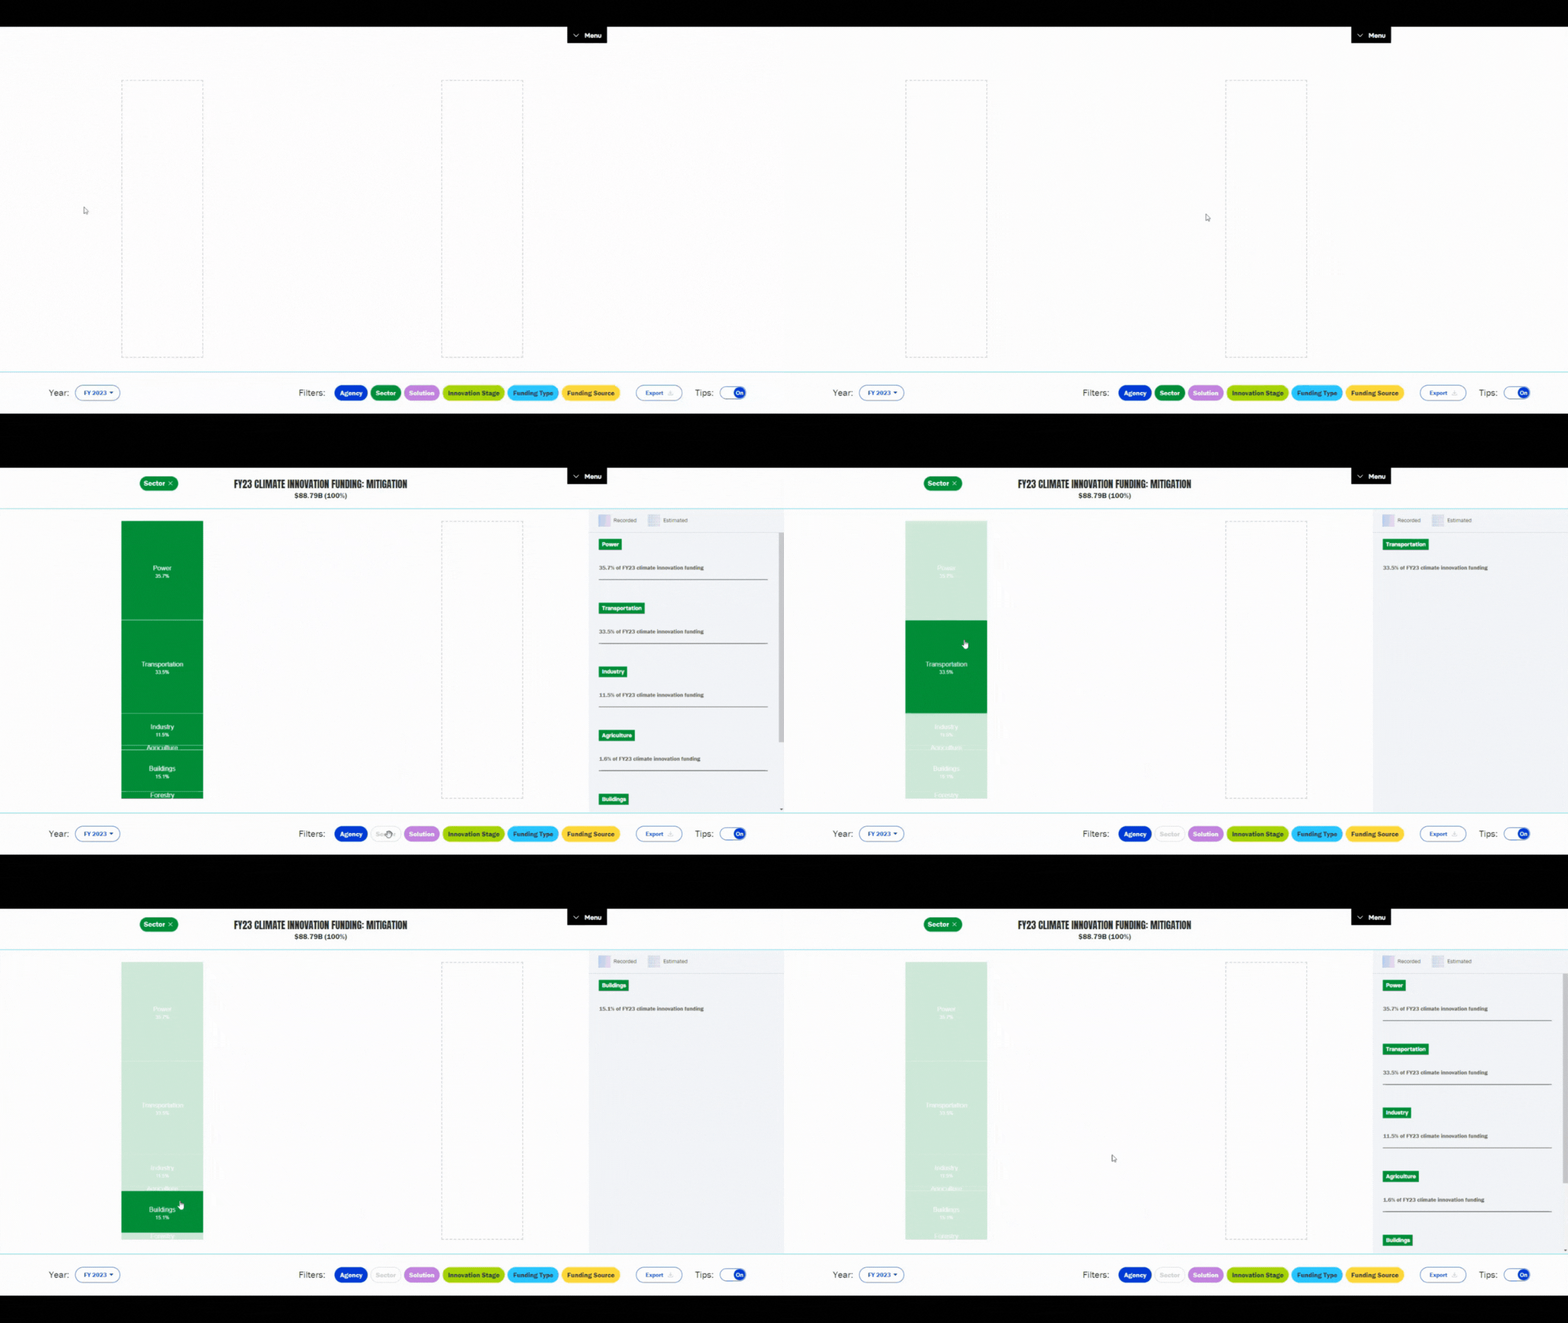
Then, drag the “Agency” filter to the box on the right to show the breakdown of the different federal agencies involved in this Sector. At any point, you can drag and drop a new filter on top of an old one to replace it.
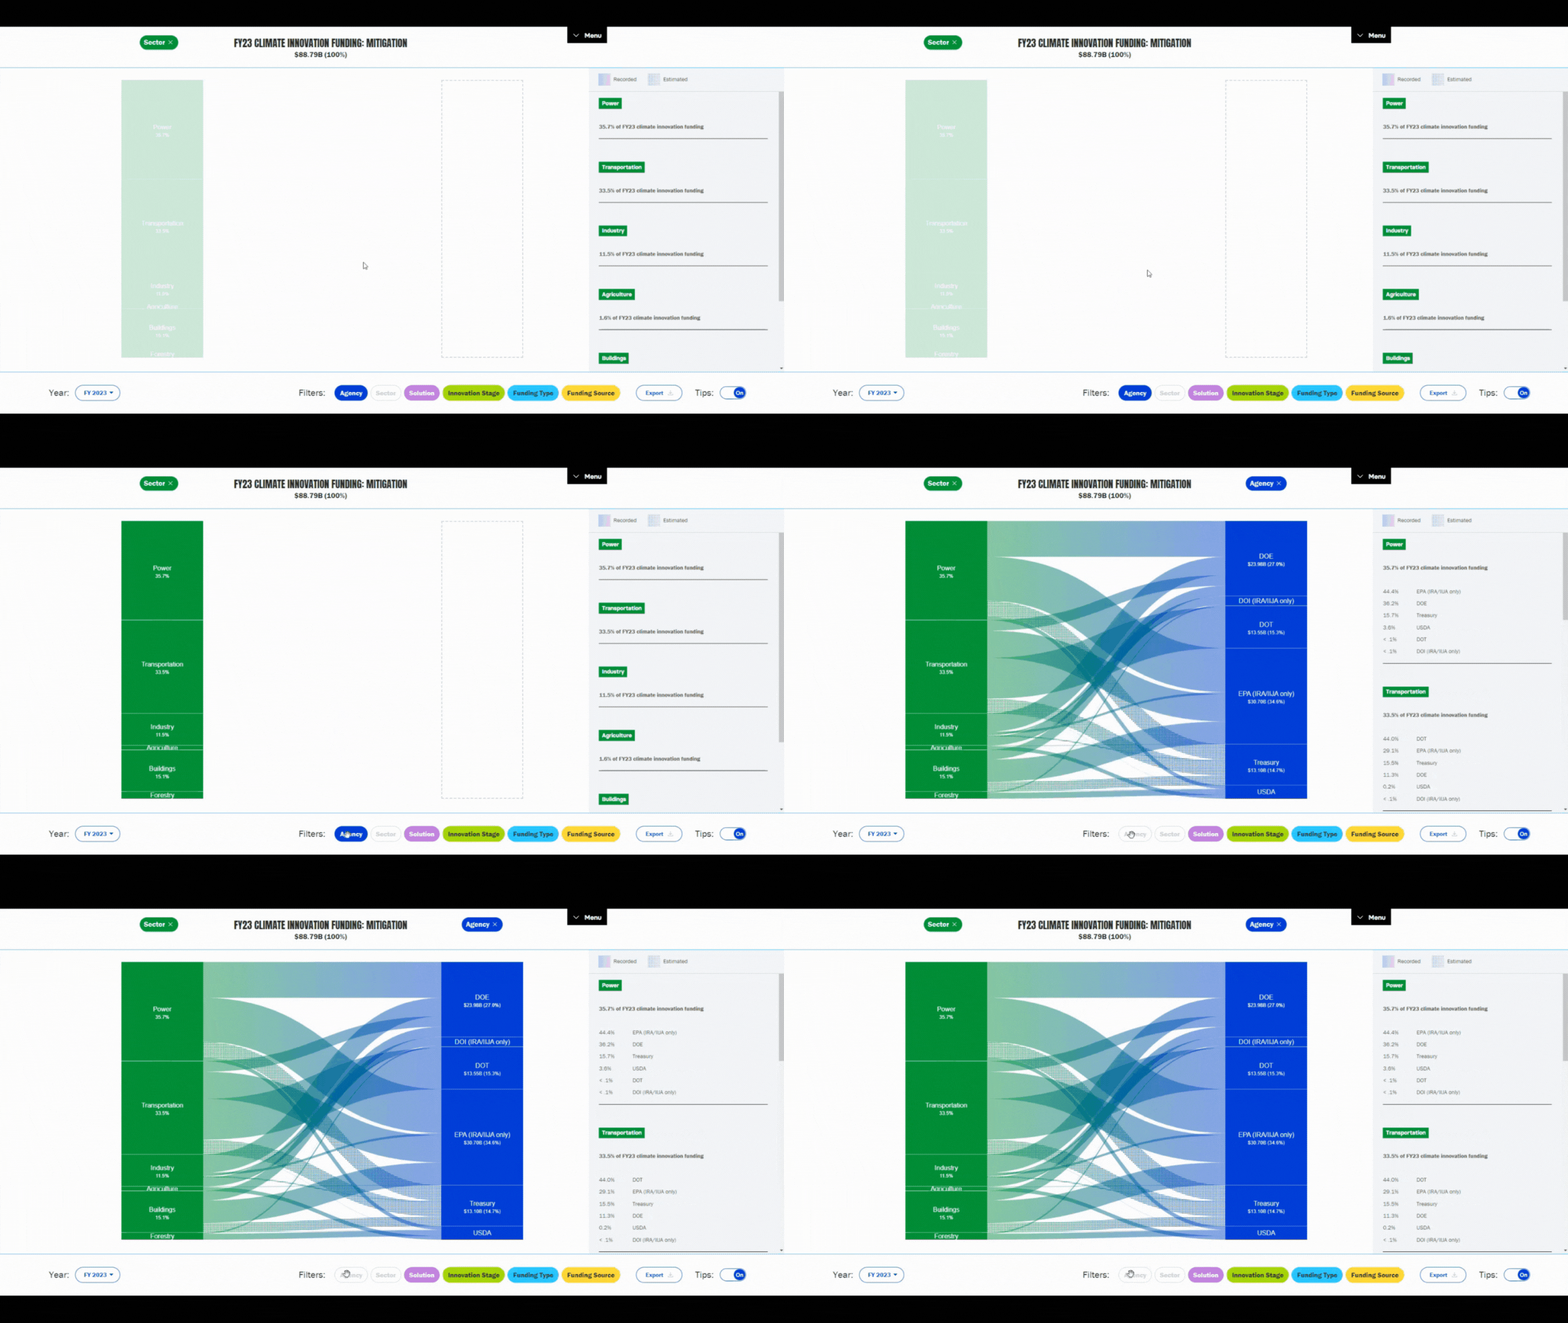
If you hover over one of the categories of interest (in this case, “Transportation”), the Sankey diagram relevant to that category will be highlighted, and the relevant budget data summarized in the gray table to the right of the chart.
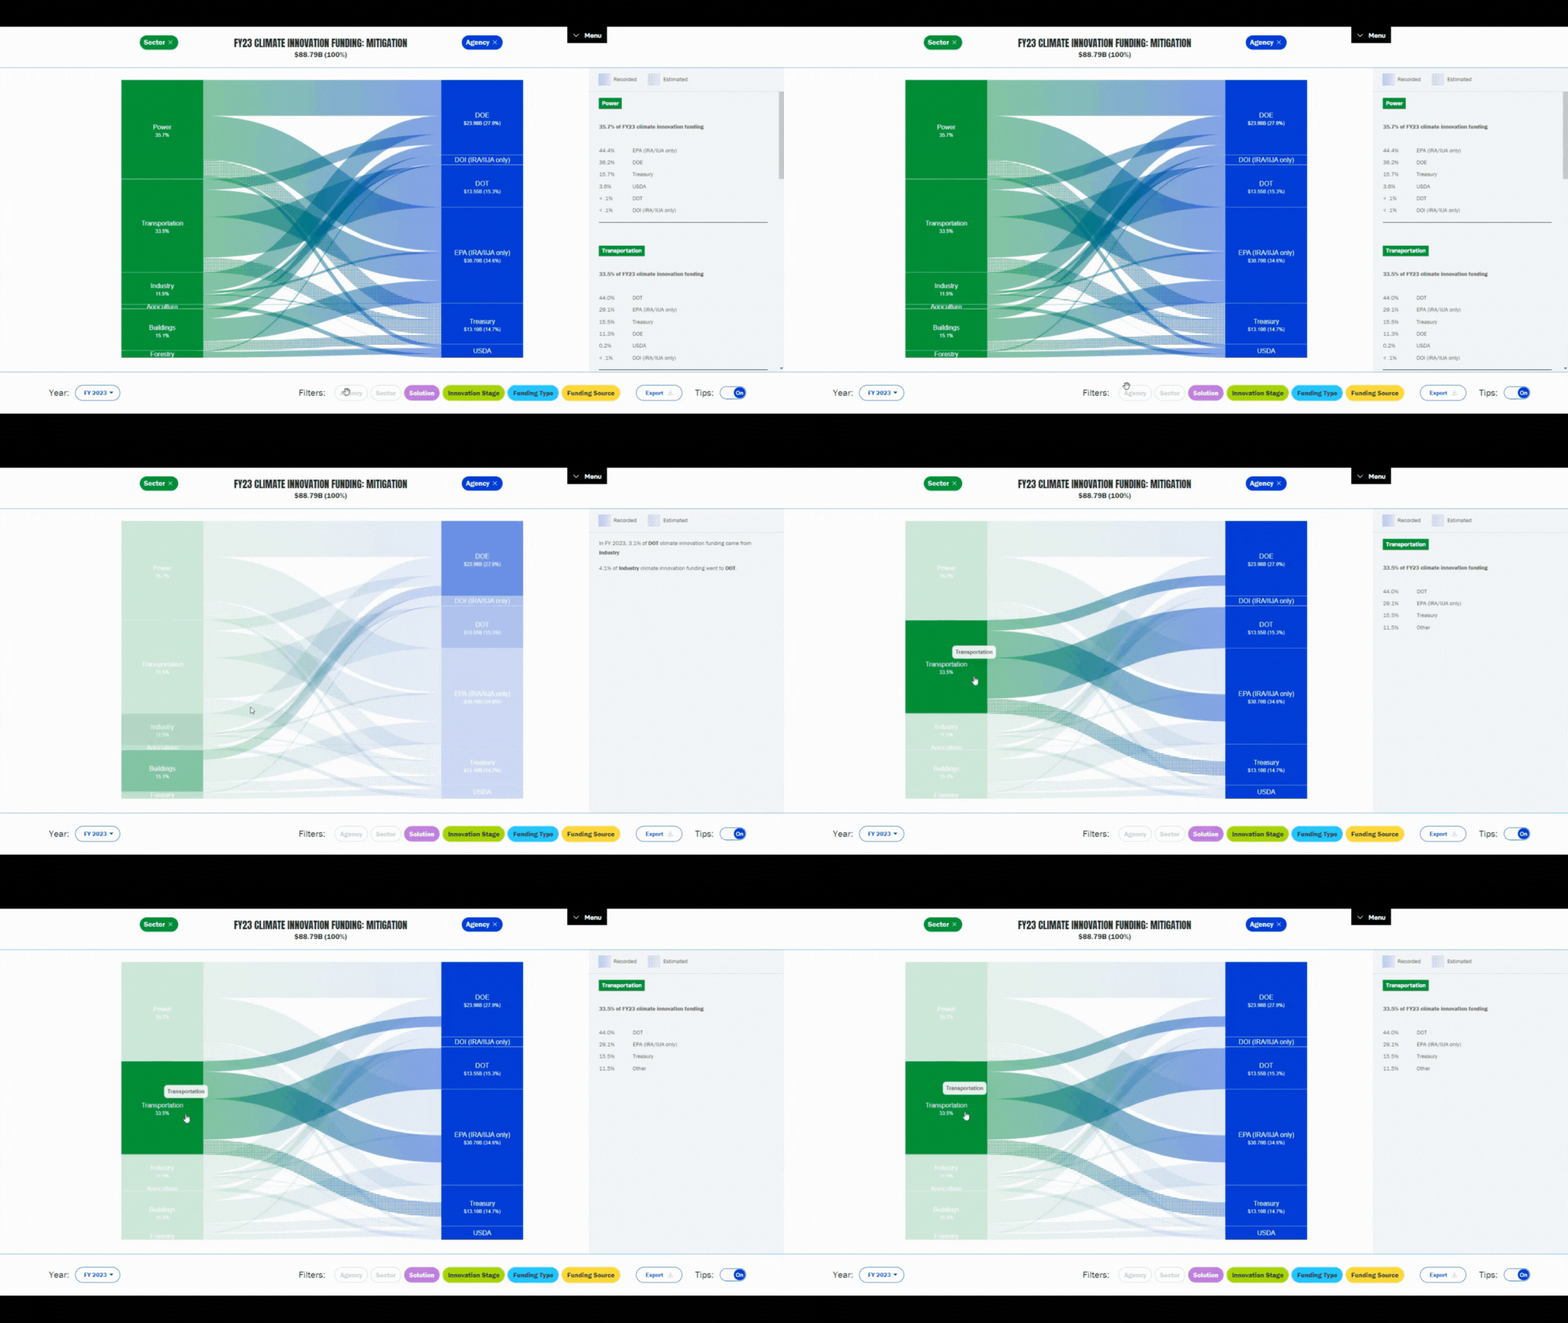
You can also isolate this Sector by clicking on Transportation. Click again to return to the high-level view.

From this, we see that the Department of Energy (DOE), the Department of Transportation (DOT), the Environmental Protection Agency (EPA), and the U.S. Department of the Treasury are the primary agencies funding climate innovation in Transportation, with the DOT spending the largest amount at $14.41 billion in the 2023 fiscal year.
You may also want to know which funding sources were responsible for driving innovation across various sectors. Replace Agency with Funding Source to view annual appropriations and other funding vehicles like the Infrastructure Investment and Jobs Act (IIJA) and the Inflation Reduction Act (IRA).
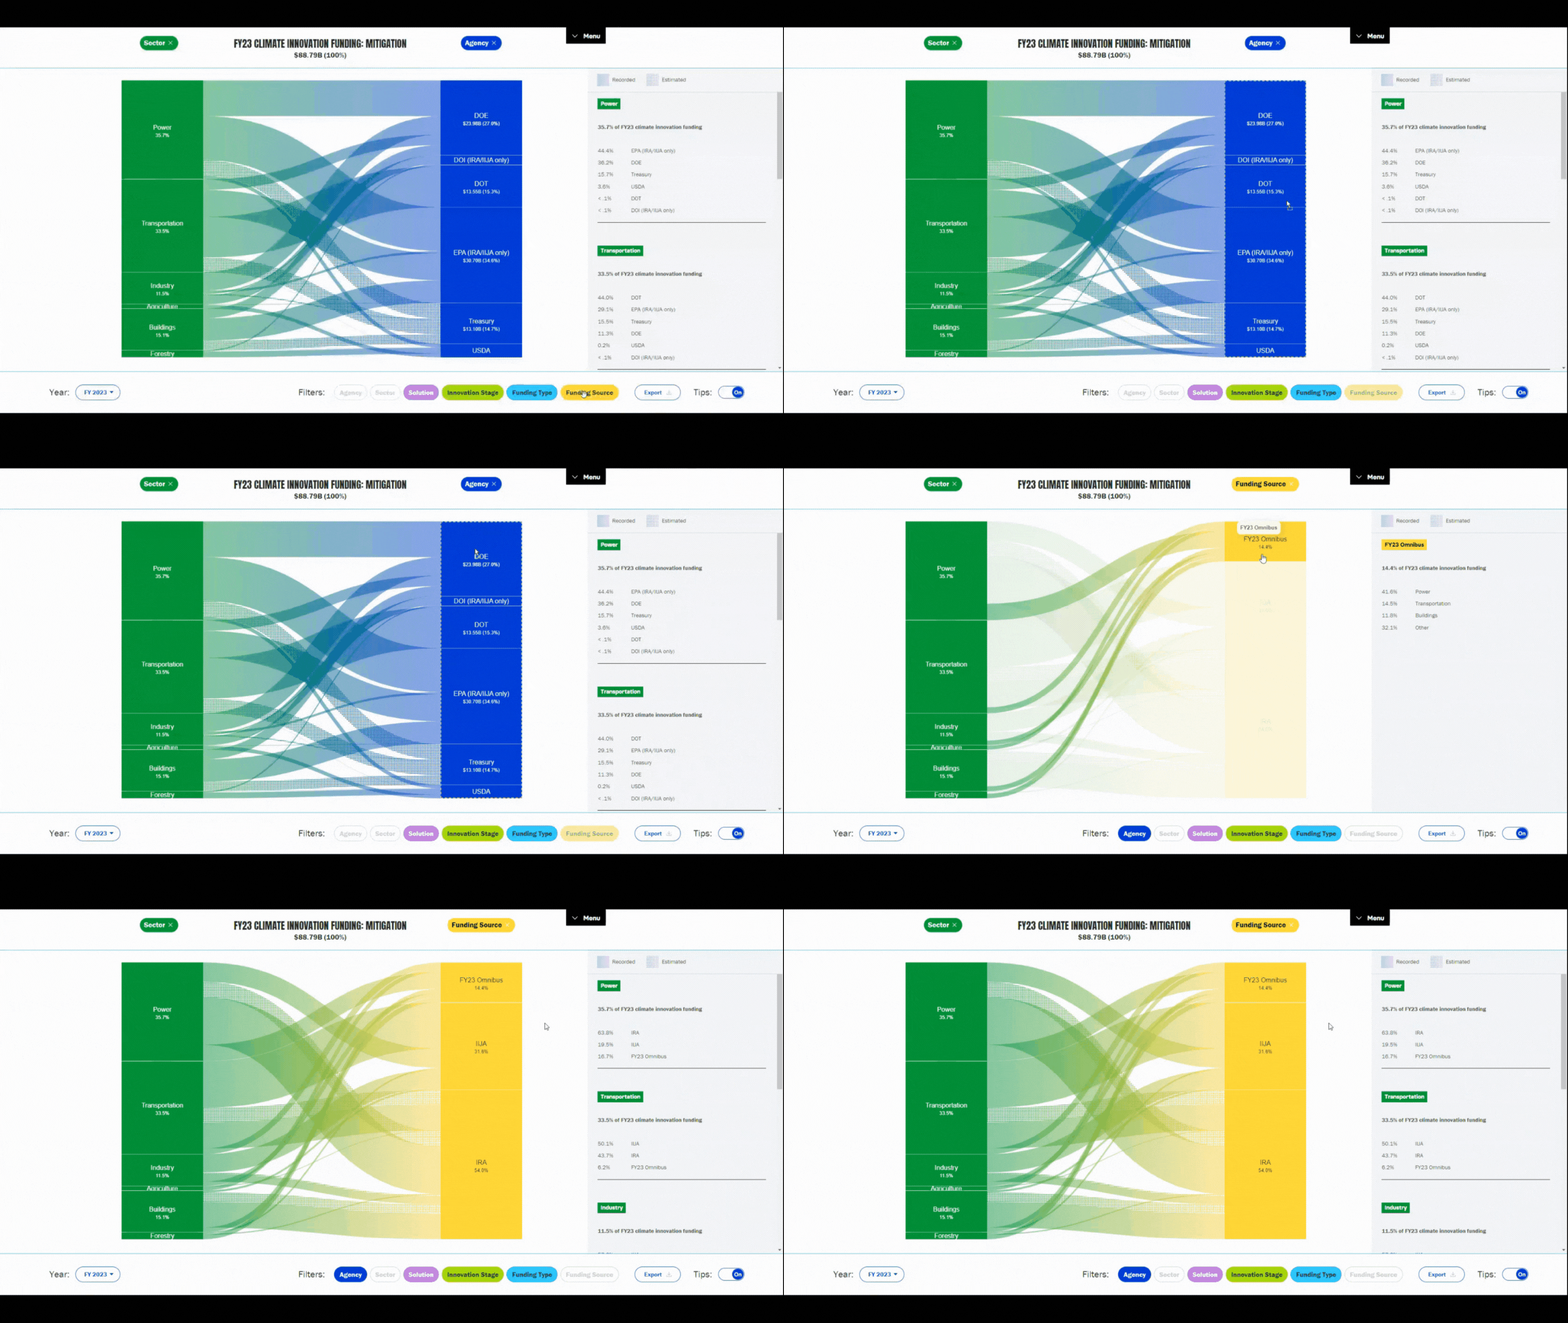
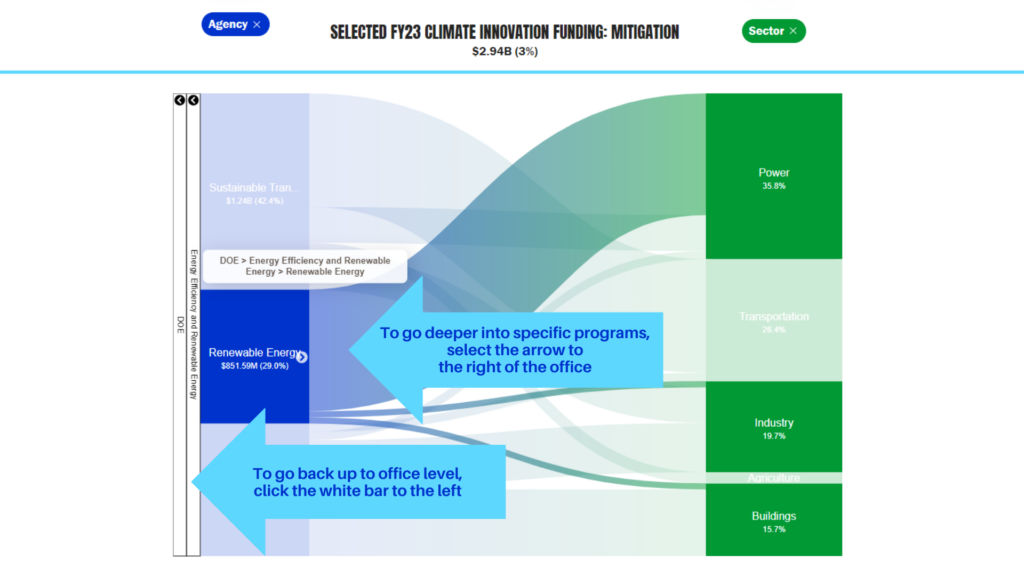
Want to dig deeper? Click the small arrow to the right of the agency’s bar to see how the funding breaks down by office, sub-office, and even by program or research area. Zoom back out of the office level by clicking the white bar to the left of the agency bar. Or just select a new filter to continue exploring.
If you want to download the data or save the information as a graphic, you can select the download icon.
Ready to try it out?
Share your insights from the tool with your colleagues and network, using the hashtag #InnovationTracker. Let us know if you have any comments or suggestions on different aspects that you’d like to see in future iterations by reaching out to InnovationTracker@edf.org! Want updates on new insights, new versions and more on the Climate Innovation Funding Tracker? Sign up for our mailing list here.